This article may contain affiliate links. We may earn a small commission at no extra cost to you if you make a purchase through these links.
MLB ABS Year One: 9,485 Challenges and a Postseason Test
Catchers win 58.6% of ABS challenges, pitchers 40.4%. A data review of MLB's first ABS season, and why October's leverage will test every team's strategy.

In its first regular season, MLB's Automated Ball-Strike (ABS) Challenge System has handled 9,485 challenges and overturned 53.7% of them, according to Baseball-Reference data as of September 10, 2026. The overall number is less telling than how it breaks down. Catchers win 58.6% of their challenges, batters 48.7% and pitchers 40.4%. Success also drops as the stakes rise, which is exactly the situation every postseason game puts players in, starting with the Wild Card Series on September 29.
When the system debuted in late March, the story was novelty: a helmet tap, a scoreboard graphic, an umpire corrected in front of a full ballpark. Our launch-month breakdown of the ABS Challenge System covered those first 1,000 or so calls. Five months later, the sample is large enough to show how teams actually use the challenge. Two things stand out. Catchers are the best-placed challengers, and teams keep challenging with confidence early in games and with hope late in them. October will punish the second habit.
How does the ABS challenge system work?
The core rules in use this season are the ones MLB announced before it began. On September 23, 2025, MLB said its Joint Competition Committee had approved the ABS Challenge System for "all Spring Training, Championship Season, and Postseason games" starting in 2026. The committee is made up of six owners, four active players and one active umpire. The key mechanics, per MLB's announcement:
- Two challenges per team per game. A successful challenge is kept, so a team only runs out after two misses.
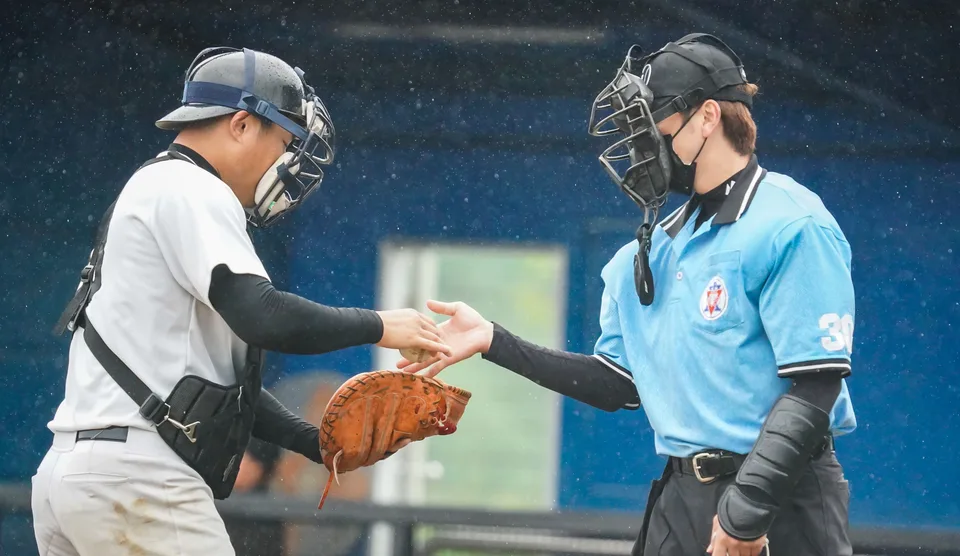
- Only the pitcher, catcher or batter can challenge. They signal by tapping their hat or helmet right after the call. No help from the dugout is allowed.
- Extra innings: a team that has no challenges left at the start of an extra inning gets one.
- The zone is a two-dimensional rectangle 17 inches wide (the width of home plate). Its top is 53.5% of the batter's certified height and its bottom is 27%. A pitch counts as a strike if any part of the ball touches any part of that zone.
- The tracking stack: 12 Hawk-Eye cameras on a private 5G network from T-Mobile for Business. MLB puts the whole process at about 15 seconds.
The camera layer is the same Hawk-Eye system that won the 20-year ball-tracking arms race. The network layer runs on the connectivity MLB's parks already have, covered in our stadium 5G analysis. The new part is the decision layer: a player has about two seconds (the window cited in MLB.com's early-season analysis) to decide whether a pitch is worth one of two scarce challenges.
What do the year-one numbers show?
All figures below come from Baseball-Reference's ABS Challenge Analysis, last updated September 10, 2026. They cover the 2026 regular season to date, which is not yet finished.
| Who challenged | Challenges | Overturned | Overturn rate | Share of all challenges |
|---|---|---|---|---|
| Catchers | 4,983 | 2,919 | 58.6% | 52.5% |
| Batters | 4,336 | 2,112 | 48.7% | 45.7% |
| Pitchers | 166 | 67 | 40.4% | 1.8% |
| Total | 9,485 | 5,098 | 53.7% | 100% |
Three findings matter more than the headline rate.
1. The role ranking from spring training held up. In MLB's 288-game ABS test during 2025 spring training, pitchers won 41% of challenges, hitters 50% and catchers 56%, according to MLB.com's Travis Sawchik. A full season later the order is the same and the numbers are close: pitchers 40.4%, batters 48.7%, catchers 58.6%. The small spring-training sample predicted the regular season well. Pitchers have mostly got the message. Their 166 challenges are under 2% of the total.
2. Teams are challenging more, not less. Baseball-Reference's monthly split shows challenges per game (both teams combined) rising from 3.76 in March to 4.19 in April, 4.60 in August and 4.67 in September so far. The overturn rate has stayed flat at roughly 52% to 55% every month. Players are not getting more accurate. They are getting more willing to use the tool. Across the season that works out to about 4.3 challenges per game over 2,195 games.
3. Most teams use about two a game. Of 4,390 team-games, 32.5% ended with exactly two challenges used, and 8.7% ended with none. Using none is almost always a wasted option. An unused challenge has no value once the game is over.
Why do overturn rates fall when the stakes rise?
This is the most important pattern in the data, and the one October will magnify. Baseball-Reference splits challenges by leverage index (LI), a measure of how much the game situation can swing on one play, where 1.0 is average. Here is how the overturn rate changes:
| Situation | Challenges | Overturn rate |
|---|---|---|
| Low leverage (LI 0.5–1.0) | 2,756 | 57.7% |
| Very high leverage (LI 2.5+) | 790 | 46.3% |
| 1st inning, two challenges left | 879 | 60.3% |
| 9th inning, two challenges left | 625 | 35.8% |
| 9th inning, one challenge left | 618 | 44.5% |
| Bases loaded | 355 | 43.9% |
| 0-0 count | 2,147 | 59.5% |
| 3-2 (full) count | 872 | 41.1% |
Adding up the inning splits, challenges in innings one through five succeeded 58.8% of the time (4,618 challenges). Challenges in innings six through nine succeeded 49.2% of the time (4,681 challenges).
This is not proof that players freeze under pressure. Our reading is that it is mostly a selection effect, and the figures support that. Early in a game, with two challenges in hand, a player only taps for a pitch he is sure about. The expected gain is small, so only near-certain misses are worth it. Late in a close game, the arithmetic reverses. A full count carries a .730 swing in run expectancy, compared with .07 for a first-pitch ball-or-strike, according to MLB.com's analysis. At that price, a 40% chance of flipping a strike three into ball four is worth taking. A lower success rate on those challenges is the rational result, not a failure.
The ninth-inning split with two challenges left (35.8%) is the clearest case. Those are teams that saved both challenges all game. At that point there is no reason to hold back, so they challenge anything close. The strategic lesson is not "challenge less late." It is "don't reach the late innings with challenges you never had a good reason to save, or with none at all."
The 0-0 count is harder to defend. It is still the most-challenged count at 2,147 challenges, 22.6% of the season total. That is despite MLB.com reporting in April that some front offices had told players never to challenge at 0-0. The 59.5% success rate there shows players only challenge obvious misses. But the payoff of turning a first-pitch strike into a ball is small. Every 0-0 challenge that fails is a lost chance to challenge a full-count pitch later.
Which teams have used ABS best, and worst?
Team results vary more than the league average suggests. Here are the extremes from Baseball-Reference as of September 10, 2026. ESPN's ABS tracker, updated September 9, lists the same top three and bottom three teams by success rate.
| Team | Challenges | Per game | Overturn rate | Note |
|---|---|---|---|---|
| Cincinnati Reds | 338 | 2.32 | 63.3% | Best in MLB; catcher/pitcher challenges 68.9% |
| Arizona Diamondbacks | 279 | 1.90 | 59.9% | Low volume, high accuracy |
| Athletics | 340 | 2.31 | 59.4% | High volume and high accuracy |
| Minnesota Twins | 404 | 2.77 | 54.5% | Most challenges in MLB |
| St. Louis Cardinals | 252 | 1.71 | 50.4% | Fewest challenges in MLB |
| Chicago White Sox | 385 | 2.66 | 49.4% | Second-most challenges, below-average accuracy |
| Cleveland Guardians | 308 | 2.10 | 48.4% | Second-lowest success rate |
| Pittsburgh Pirates | 315 | 2.16 | 47.0% | Lowest success rate in MLB |
The team data points to one strategic conclusion: the catcher is the challenge strategy. The Reds' 63.3% rests largely on Tyler Stephenson, who has won 93 of 133 challenges (69.9%). Among high-volume challengers, J.T. Realmuto of the Philadelphia Phillies is at 75.0% (57 of 76) and Salvador Perez of the Kansas City Royals at 73.0% (54 of 74). These totals include a handful of challenges each player made as a batter. Volume and accuracy don't always come together. Milwaukee's William Contreras leads MLB with 175 challenges but wins 54.9% of them, about the league average. That is still useful when he challenges this often, but it doesn't match the elite catchers.
On the batting side, the best numbers are much lower. ESPN's top batter, Cincinnati's Sal Stewart, is 27-for-47 (57.4%). Batters as a group succeed 48.7% of the time, and 37.8% on full counts. That supports the MLB.com rule of thumb from April: batters should challenge rarely, and mainly when a good hitter is at the plate in a high-leverage spot.
What changes when ABS reaches the postseason?
MLB's September 2025 announcement names the postseason among the games where the Challenge System applies. It does not describe a separate postseason rule set, so teams should expect the same two-challenge format. What changes is the situation. According to MLB's postseason schedule, the best-of-three Wild Card Series starts Tuesday, September 29. The Division Series begin October 3, the NLCS October 11, the ALCS October 12, and the World Series October 23, with a possible Game 7 on October 31.
Four things to watch, based on the regular-season data:
- Every inning becomes higher leverage. The season's 790 very-high-leverage challenges succeeded 46.3% of the time. In an elimination game, more of the game sits in that range. Expect the postseason overturn rate to come in below 53.7%, and don't read that as the system failing.
- Catcher quality becomes a roster question. In a short series, a catcher who wins seven of ten challenges versus one who wins five of ten can decide a full-count pitch in a one-run game. Front offices that did not factor challenge skill into catcher value before now have a season of data to go on.
- The 0-0 habit will be tested. A team that loses a first-inning, first-pitch challenge in a winner-take-all game gives up an option it may need in the eighth. The regular season allowed that kind of mistake. A Wild Card Game 3 will not.
- Umpire assignments matter more. ESPN's tracker shows overturn rates against individual umpires varying widely, though several samples are small. Postseason crews are selected, which may narrow the spread. Teams will still prepare with each plate umpire's challenge history in hand.
What should teams, broadcasters and fans take from year one?
The system works as a tool for fixing calls, and players are learning to use it as a strategic resource. As of September 10, 2026, 5,098 calls have been corrected, each in a process MLB puts at about 15 seconds. The remaining gap is in decisions, not technology. The data consistently rewards teams that let catchers lead, save challenges for counts that matter, and accept a lower success rate when the stakes justify it.
For the wider sports-tech market, ABS is the clearest proof yet that a "human first, machine on appeal" model can scale. Compare it with FIFA's approach, covered in our look at semi-automated offside at the 2026 World Cup, where tracking technology automatically flags offside positions to officials instead of waiting for a team to appeal. MLB kept the umpire as the default and turned the correction into a limited resource that players manage. That design creates a new skill to measure, coach and pay for. As of this season, catchers own it.
Frequently Asked Questions
How many ABS challenges have there been in 2026?
As of September 10, 2026, Baseball-Reference counts 9,485 ABS challenges in the MLB regular season, with 5,098 overturned, a 53.7% overturn rate. That works out to about 4.3 challenges per game across both teams. The rate has risen from 3.76 per game in March to 4.67 so far in September. The regular season is not finished, so the totals are still growing.
Who is most successful at ABS challenges: catchers, batters or pitchers?
Catchers, by a clear margin. As of September 10, 2026, catchers have won 58.6% of their 4,983 challenges, batters 48.7% of 4,336, and pitchers 40.4% of 166. The same order appeared in MLB's 288-game spring training test in 2025. Catchers have the best view of the zone and see the most pitches, so most teams now let them lead challenge decisions.
Is the ABS challenge system used in the MLB postseason?
Yes. MLB's September 2025 announcement said the Challenge System would be used in all Spring Training, regular-season and postseason games starting in 2026. The announcement describes no separate postseason rules, so each team starts every game with two challenges and keeps any it wins. The 2026 postseason begins with the Wild Card Series on September 29.
Which MLB team is best at ABS challenges?
As of September 10, 2026, the Cincinnati Reds lead MLB with a 63.3% overturn rate on 338 challenges, per Baseball-Reference and ESPN. The Arizona Diamondbacks (59.9%) and Athletics (59.4%) follow. The Pittsburgh Pirates rank last at 47.0%. Much of Cincinnati's edge comes from catcher Tyler Stephenson, who has won 69.9% of his 133 challenges.
Why are late-inning ABS challenges less successful?
Mostly because of which pitches get challenged. Early in games, players only challenge near-certain misses. Late in close games, a single call can swing a lot of run value, so a 40% chance of winning a challenge becomes worth taking. As of September 10, 2026, ninth-inning challenges made with two challenges left succeeded only 35.8% of the time, versus 60.3% in the first inning.
Enjoying this article?
Get more strategic intelligence delivered to your inbox weekly.
Enjoyed this article?
VentureBeast.Tech is independent and reader-supported. If this saved you time, you can buy us a coffee — it keeps the research deep and the site ad-light.
Support us on Ko-fi


Comments (0)
No comments yet. Be the first to share your thoughts!